Understanding Loki
Intro
Loki is “like prometheus” but for logging. It is designed to handle large volumes of data so it is highly scalable and available.
High level architecture
Agent is responsible to push logs to Loki. Loki is responsible to process and store the logs. The logs can be then queried through a frontend(eg.- Grafana).
Components
-
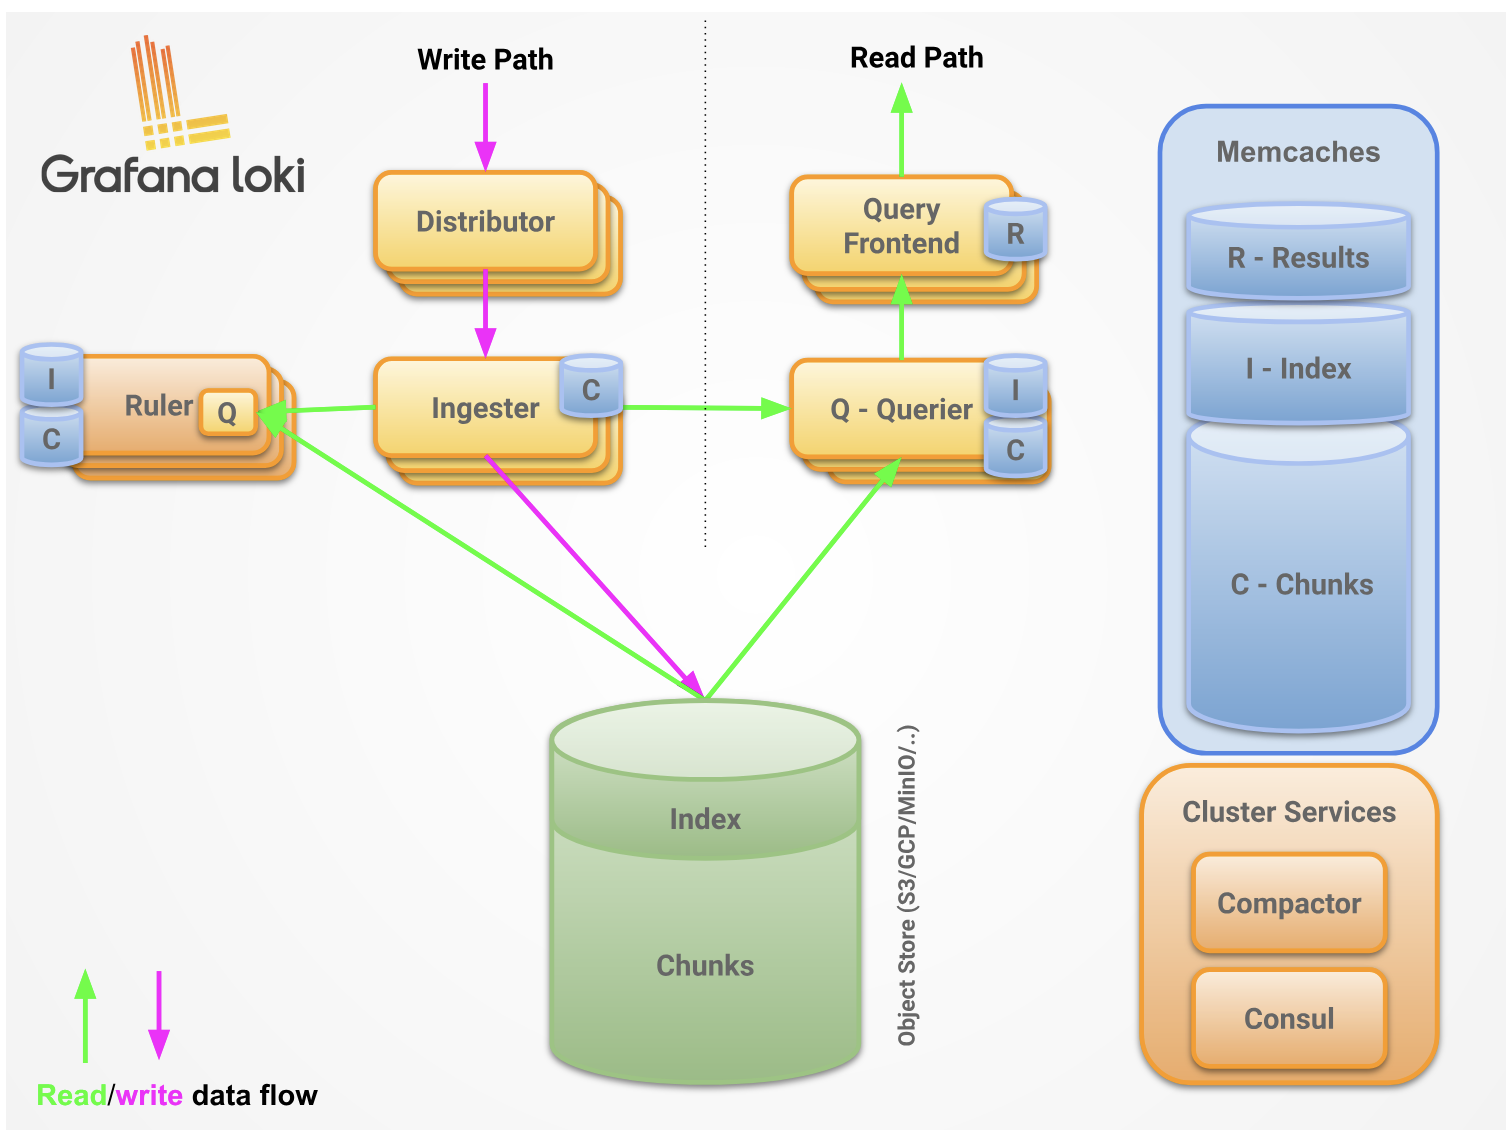
Distributor - Takes in the logs from the agent, processes and cleans it up and distributes them to the ingester.
-
Ingestor - Ingestor keeps the logs and pushes/flushes to storage periodically. Generally, the same log is sent to multiple ingesters for redundancy. All ingestors participate in the loki hash ring(based on consistent hashing) to keep the system highly scalable and available.
-
Query Frontend - Query Frontend optimizes and speeds up queries by caching and splitting them beforesending to queriers.
-
Querier - It queries the data from object store and ingester and passes back to query frontend.
-
Ruler - Ruler evaluates log-based alerting rules and sends alerts to Alertmanager.
Data Flow
Deployment Modes
- Monolithic Mode - The entire loki is deployed as a single binary object. This is hard to scale.
- Microservices Mode - The components are deployed individually so you can scale different components according to the need.
- Simple Scalable - Middle ground between monolithic and microservices. Components are clubbed and made into a single component and then deployed individually. Digestor and Ingestor becomes one, querier and query frontend becomes one component.
Note: UI(eg.- Grafana) and the agent(eg.- promtail) is not part of loki.
Storage
The logs are compressed and eventually pushed to s3, google cloud bucket or some other remote cloud