Monitoring Kubernetes with Prometheus and Grafana: A Quick Overview
Prometheus is an open-source tool designed to export and serve metrics. These metrics can come from a variety of sources — such as servers, applications, or really anything a user wants to track. In my case, I wanted to monitor the resource usage of a Kubernetes cluster. To prove the concept, I installed Prometheus in my cluster using Helm, which made the setup straightforward and manageable.
Along with Prometheus, I also deployed node-metrics and cAdvisor to gather detailed system and container-level statistics. Node-metrics helps collect metrics directly from the nodes, providing insight into CPU, memory, and disk usage, while cAdvisor monitors container performance and resource consumption.
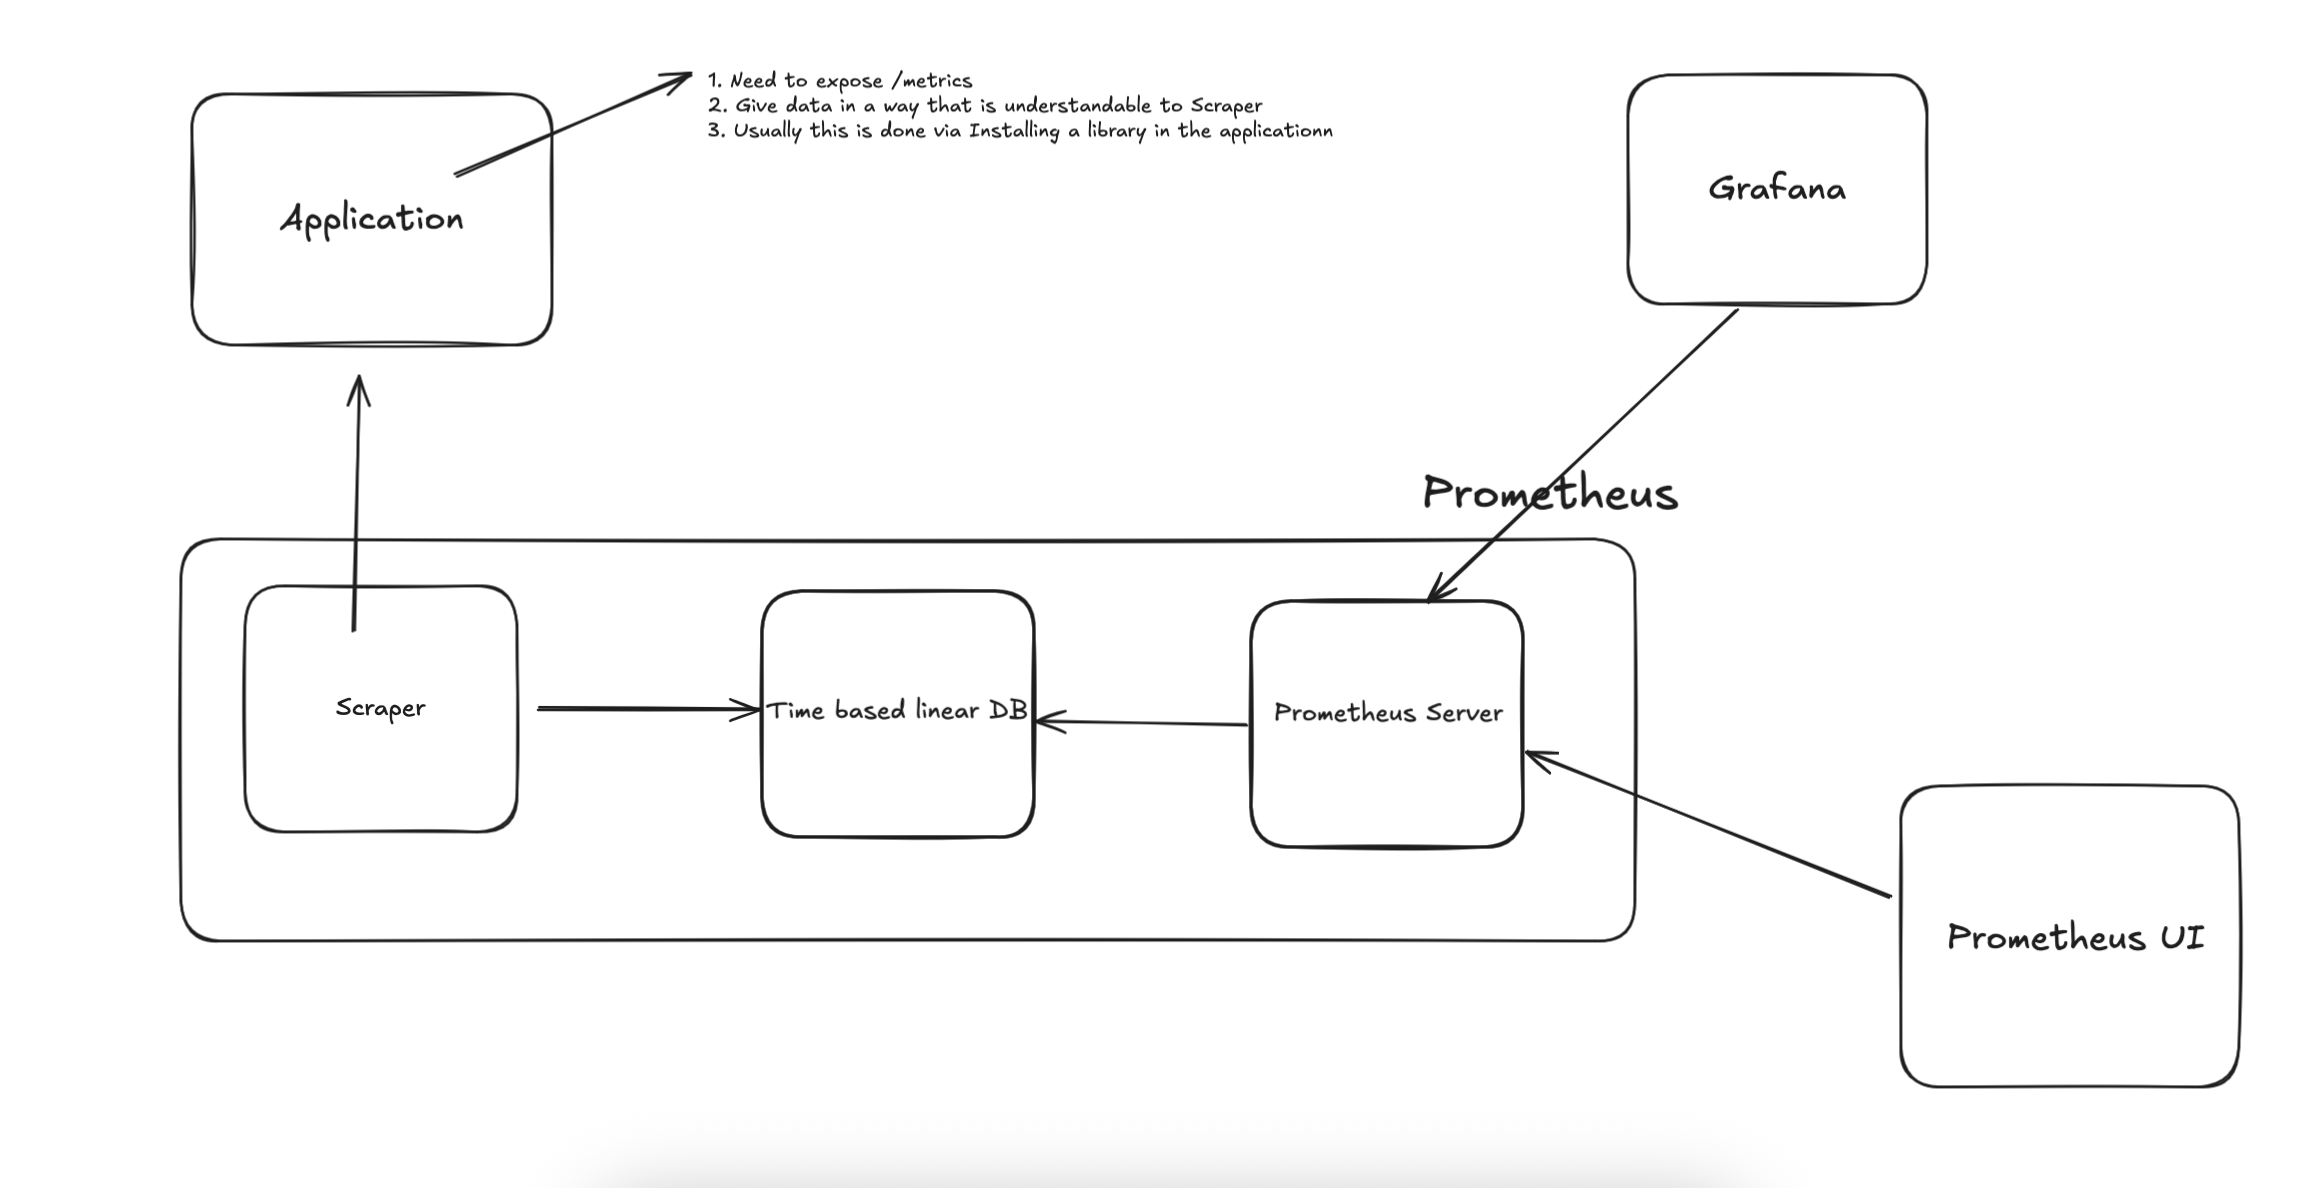
After setting up these components, I exposed an endpoint on the server for a scraper to collect metrics data. The scraper gathers this data and pushes it to the Prometheus server. From there, the server makes these metrics available for anyone interested in consuming the information, whether through the Prometheus web UI or visualization tools like Grafana. This setup enables real-time monitoring and valuable insights into the health and performance of the Kubernetes cluster.